Emissivity of the Earth as a Cancer Predictor
DOI:
https://doi.org/10.62487/em45cr75Keywords:
Emissivity, Environment as predictor, Cancer incidence, Infrared radiationAbstract
Aim: The anticancer properties of locally applied infrared radiation are widely discussed in the literature. Earth's global emissivity, or the infrared radiation emitted by our planet, is inhomogeneous and varies based on the geophysical characteristics of the region where one resides. This study aimed to test the hypothesis: does local emissivity influence the prevalence of malignant diseases in a region. Materials and Methods: We performed planimetric comparison of two World maps: 1. NASA Spacecraft Map of Earth's Global Emissivity; 2. GLOBOCAN 2020 Global Cancer Data. For comparison we used “Image Compare” tool from Oxford Robotics Research Group. For the area measurements we used FreeMapsTools calculator. Results: The total assessed area was 127,750,000 square kilometers. The distribution according to emissivity was as follows: 107,050,000 km² of area with emissivity above 0.94 and 20,700,000 km² of area with emissivity below 0.94. The distribution according to cancer incidence was as follows: 28,150,000 km² of area with cancer incidence lower than 180 per 100,000 and 99,600,000 km² of area with cancer incidence more than 180 per 100,000. Cancer incidence was found to be statistically significantly associated with higher emissivity of the defined area (p-value < 0.0001). Conclusion: We found a significant association between areas of higher emissivity on our planet and higher cancer incidence. Our findings underscore the need to include environmental factors, in our case infrared radiation exposure, as potential predictor in the deployment of cancer predictive models, such as those involving machine learning and artificial intelligence.
World Map Overlay:
Cancer Incidence and Earth Emissivity
This web app overlays GLOBOCAN cancer incidence data with NASA's Earth emissivity maps, as described in the article. Click on a region in the world map to view cancer incidence rates and emissivity for the selected area.


Original Article
Background
Infrared radiation for cancer treatment
In the last decade, there has been a proliferation of articles in clinical oncology about the successful treatment of malignant tumors with infrared radiation1 2 3 4 5 6 7. Infrared radiation is the spectrum of electromagnetic light that is invisible to us; however, we can feel its presence as it generates heat8.
Emissivity can be artificially produced, for example, through infrared lamps or generators, or it can be natural, such as the emissivity of our planet, the spectrum of sunlight, or the emissivity of the human body.
Emissivity of natural body depends of its structure9 10. And it could be measured for each physical object as a ratio of its thermal radiation to the thermal radiation of the ideal black body9. The higher the ratio, the higher the emissivity of the defined object. For example, the emissivity of human skin is between 0.96 and 0.99, and it depends on pigmentation11.
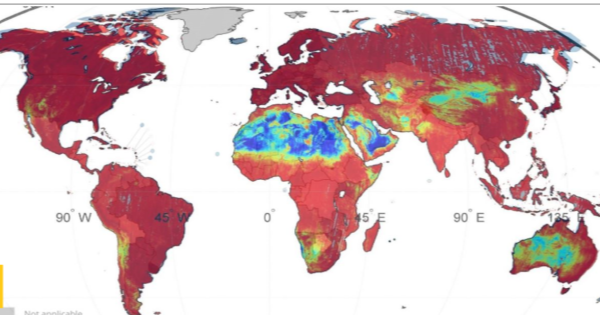
Earth's global emissivity, or the thermal infrared radiation emitted by our planet, is inhomogeneous and varies based on the geophysical characteristics of the region where one resides10 It does not depend on the sun's activity in the region or weather conditions10. However, it does depend on ground properties10. Thus, areas with quartz sands have the lowest emissivity, in the range of 0.6-0.810. Whereas, areas with high plant activity have the highest emissivity, ranging from 0.9 to 1.010.
Hypothesis
Based on the provided data, the emissivity of the Earth is constant but not uniform across its surface. Consequently, the effects of emissivity on the human body are not transient and vary depending on the local ground characteristics. Emissivity can influence the activity of the immune system and cancer proliferation. Therefore, people around the world may experience different rates of cancer incidence and prevalence, which could be dependent on the emissivity of their specific geographical region.
Aim
This study aimed to test the hypothesis: does local emissivity influence the prevalence of malignant diseases in a region.
Material and Methods
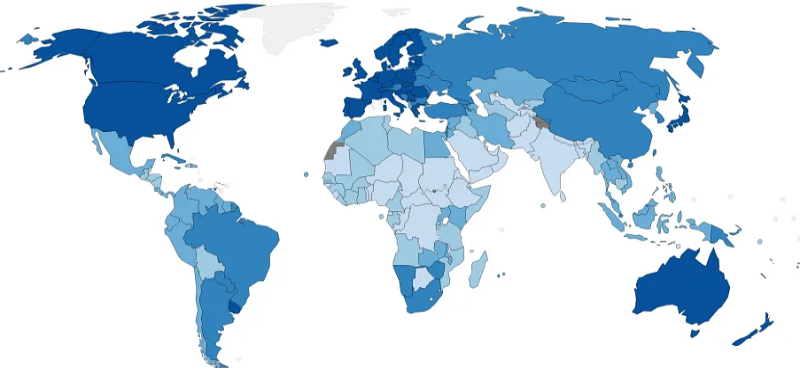
We conducted a planimetric comparison of two global maps: 1. NASA's Spacecraft Map of Earth's Global Emissivity and 2. GLOBOCAN 2020 Global Cancer Data. Both maps were utilized as JPEG images. By trimming both maps to identical geographic borders and aligning the pixel sizes, we ensured that both images shared the same resolution and dimensions: a width of 903 pixels and a height of 432 pixels. The comparison was facilitated using the "Image Compare" tool from the Oxford Robotics Research Group. An overlay technique was employed, allowing for dynamic prioritization of one map's details over the other (Figure 1).

Figure 1: Overlay with dominance of NASA Spacecraft Map of Earth's Global Emissivity over GLOBOCAN 2020 Global Cancer Data. B: Overlay with dominance of GLOBOCAN 2020 Global Cancer Data over NASA Spacecraft Map of Earth's Global Emissivity.
The alignment of the two maps was evaluated through empirical planimetry and color accordance, categorizing the alignment into four types across two Emissivity Grades: less than 0.94 (represented by blue-green-yellow) and greater than 0.94 (represented by red); alongside two cancer incidence rates: less than 180 per 100,000 (sky blue) and more than 180 per 100,000 (navy blue) (Table 1). The selection process was based on the correlation of two maps according to color patterns that rely on emissivity grade and cancer distribution. The possible interactions between the two maps, or one from the four available options (Table 1), were then extrapolated and manually measured with FreeMapsTools in km². The cutoff values for emissivity (0.94) and cancer prevalence (180 per 100,000) were chosen at these levels because of the definitive color patterns.
|
Grade |
Emissivity |
Cancer incidence* |
|
1 (low) |
<0.94 (blue-yellow) |
<180 (sky blue) |
|
2 (high) |
>0.94 (red) |
>180 (navy blue) |
Table 1: Interaction between the maps
* per 100.000
The degree of alignment was calculated separately for each continent where data for both parameters were available: North America, South America, Africa, Europe, Asia, and Australia. Collected areas from all available continents were categorized into four types:
1. Low emissivity (<0.94), low cancer incidence (< 180 per 100.000)
2. Low emissivity (<0.94), high cancer incidence (>180 per 100.000)
3. High emissivity (>0.94), high cancer incidence (>180 per 100.000)
4. High emissivity (>0.94), low cancer incidence (<180 per 100.000).
Statistics
The collected data were analyzed using a 2x2 table or the two-tailed Fisher's exact test. P-value < 0.05 was considered statistically significant.
Results
The total assessed area was 127,750,000 square kilometers.
The distribution according to emissivity was as follows: 107,050,000 km² of area with emissivity above 0.94 and 20,700,000 km² of area with emissivity below 0.94. The distribution according to cancer incidence was as follows: 28,150,000 km² of area with cancer incidence lower than 180 per 100,000 and 99,600,000 km² of area with cancer incidence more than 180 per 100,000. The results are summarized in Table 2.
|
Type of Alignment |
North America |
South America |
Africa |
Europe |
Asia |
Australia |
All |
|
Emissivity 1 + Cancer incidence 1 |
1.5M |
1.5M |
4M |
0.1M |
5M |
0 |
12.1M |
|
Emissivity 1 + Cancer incidence 2 |
0.5M |
0.1M |
1M |
0 |
3M |
4M |
8.6M |
|
Emissivity 2 + Cancer incidence 1 |
1M |
4M |
5M |
0.05M |
6M |
0 |
16.05M |
|
Emissivity 2 + Cancer incidence 2 |
19M |
12M |
20M |
10M |
30M |
3M |
91M |
Table 2: Alignment of Emissivity Grade with Cancer Incidence Grade from Table 1. Data are presented in square kilometers (km²).
M million
Cancer incidence was found to be statistically significantly associated with higher emissivity of the region, with a two-tailed p-value of less than 0.0001.
Discussion
Practical standpoint
We found that higher Earth's emissivity is significantly associated with higher cancer incidence. Our findings contradict the anticancer properties of infrared light described in the introduction. Here is a possible explanation of such discrepancy:
1. One explanation for our findings is that individuals living continuously in a defined region are chronically exposed to emissivity, unlike patients who are treated over a short period.
2. Another explanation could be the potential difference in the spectrum of infrared light used for tumor treatment compared to the natural emissivity of our planet.
3. It is possible that infrared light can be carcinogenic under certain conditions. Preexposure to IR might increase the aggressiveness and growth of malignant tumors if it is applied prior to or with UV radiation12 13.
4. It is also possible that our findings are merely coincidental. Consequently, chronic exposure to IR, such as visiting saunas, may not be associated with either anticancer or carcinogenic outcomes14.
To the best of our knowledge, our study is the first to assess the influence of Earth's emissivity and natural infrared exposure on cancer incidence.
Limitations
First, our study utilized an experimental model based on the comparison of two world maps, employing empirically defined cutoff values for overlays, which could affect the representativeness of the data.
Second, the calculation of the area was performed with potential bias due to the manual nature of data extrapolation from overlaid maps to the FreeMapsTools area calculator.
The third limitation of our study is the confounding effects of inhomogeneous population distribution and other local economic, social, and environmental factors within the defined areas, which could also impact our results.
Conclusion
We found a significant association between areas of higher emissivity on our planet and higher cancer incidence. Our findings underscore the need to include environmental factors, in our case infrared radiation exposure, as potential predictors in the deployment of cancer predictive models, such as those involving machine learning and artificial intelligence.
Conflict of Interest: authors state that no conflict of interest exists.
Authorship: YR: Concept, data analysis, original draft. YR, VR, MD: Review and editing.
References
1 Tanaka Y, Tatewaki N, Nishida H, Eitsuka T, Ikekawa N, Nakayama J. Non-thermal DNA damage of cancer cells using near-infrared irradiation. Cancer Sci. 2012;103(8):1467-1473. doi:10.1111/j.1349-7006.2012.02310.x.
2 Kobayashi H, Furusawa A, Rosenberg A, Choyke PL. Near-infrared photoimmunotherapy of cancer: a new approach that kills cancer cells and enhances anti-cancer host immunity. Int Immunol. 2021;33(1):7-15. doi:10.1093/intimm/dxaa037.
3 Ishibashi J, Yamashita K, Ishikawa T, et al. The effects inhibiting the proliferation of cancer cells by far-infrared radiation (FIR) are controlled by the basal expression level of heat shock protein (HSP) 70A. Med Oncol. 2008;25(2):229-237. doi:10.1007/s12032-007-9020-4.
4 Li K, Xia L, Liu NF, et al. Far infrared ray (FIR) therapy: An effective and oncological safe treatment modality for breast cancer related lymphedema. J Photochem Photobiol B. 2017;172:95-101. doi:10.1016/j.jphotobiol.2017.05.011.
5 Kato T, Furusawa A, Okada R, et al. Near-Infrared Photoimmunotherapy Targeting Podoplanin-Expressing Cancer Cells and Cancer-Associated Fibroblasts. Mol Cancer Ther. 2023;22(1):75-88. doi:10.1158/1535-7163.MCT-22-0313.
6 Mu Y, Jin Z, Yan Y, Tao J. Effect of far-infrared fabrics on proliferation and invasion of breast cancer cells. IJCST. 2022;34(6):933-946. doi:10.1108/IJCST-10-2021-0156.
7 Kim H-B, Park J-H. Novel Application of Infrared Radiation Therapy: Spirit Identity Powder-Generated Far Infrared Radiation Inhibits the Proliferation of Human Male Liver Cancer Cells by Activating the Transmembrane Attack Complex. Applied Sciences. 2022;12(19):9416. doi:10.3390/app12199416.
8 NASA Science. Infrared Waves. link. Accessed February 23, 2024.
9 Wikipedia. Emissivity. link. Accessed February 26, 2024.
10 Owen T. ASTER Global Emissivity Database: 100 Times More Detailed than its Predecessors. link. Accessed February 21, 2024.
11 Charlton M, Stanley SA, Whitman Z, et al. The effect of constitutive pigmentation on the measured emissivity of human skin. PLoS One. 2020;15(11):e0241843. doi:10.1371/journal.pone.0241843.
12 Jantschitsch C, Weichenthal M, Maeda A, Proksch E, Schwarz T, Schwarz A. Infrared radiation does not enhance the frequency of ultraviolet radiation-induced skin tumors, but their growth behaviour in mice. Exp Dermatol. 2011;20(4):346-350. doi:10.1111/j.1600-0625.2011.01257.x.
13 Kimeswenger S, Schwarz A, Födinger D, et al. Infrared A radiation promotes survival of human melanocytes carrying ultraviolet radiation-induced DNA damage. Exp Dermatol. 2016;25(6):447-452. doi:10.1111/exd.12968.
14 Laukkanen JA, Mäkikallio TH, Khan H, Laukkanen T, Kauhanen J, Kunutsor SK. Finnish sauna bathing does not increase or decrease the risk of cancer in men: A prospective cohort study. Eur J Cancer. 2019;121:184-191. doi:10.1016/j.ejca.2019.08.031.
References
Tanaka Y, Tatewaki N, Nishida H, Eitsuka T, Ikekawa N, Nakayama J. Non-thermal DNA damage of cancer cells using near-infrared irradiation. Cancer Sci. 2012;103(8):1467-1473. doi:10.1111/j.1349-7006.2012.02310.x. DOI: https://doi.org/10.1111/j.1349-7006.2012.02310.x
Kobayashi H, Furusawa A, Rosenberg A, Choyke PL. Near-infrared photoimmunotherapy of cancer: a new approach that kills cancer cells and enhances anti-cancer host immunity. Int Immunol. 2021;33(1):7-15. doi:10.1093/intimm/dxaa037. DOI: https://doi.org/10.1093/intimm/dxaa037
Ishibashi J, Yamashita K, Ishikawa T, et al. The effects inhibiting the proliferation of cancer cells by far-infrared radiation (FIR) are controlled by the basal expression level of heat shock protein (HSP) 70A. Med Oncol. 2008;25(2):229-237. doi:10.1007/s12032-007-9020-4 DOI: https://doi.org/10.1007/s12032-007-9020-4
Li K, Xia L, Liu NF, et al. Far infrared ray (FIR) therapy: An effective and oncological safe treatment modality for breast cancer related lymphedema. J Photochem Photobiol B. 2017;172:95-101. doi:10.1016/j.jphotobiol.2017.05.011. DOI: https://doi.org/10.1016/j.jphotobiol.2017.05.011
Kato T, Furusawa A, Okada R, et al. Near-Infrared Photoimmunotherapy Targeting Podoplanin-Expressing Cancer Cells and Cancer-Associated Fibroblasts. Mol Cancer Ther. 2023;22(1):75-88. doi:10.1158/1535-7163.MCT-22-0313. DOI: https://doi.org/10.1158/1535-7163.MCT-22-0313
Mu Y, Jin Z, Yan Y, Tao J. Effect of far-infrared fabrics on proliferation and invasion of breast cancer cells. IJCST. 2022;34(6):933-946. doi:10.1108/IJCST-10-2021-0156. DOI: https://doi.org/10.1108/IJCST-10-2021-0156
Kim H-B, Park J-H. Novel Application of Infrared Radiation Therapy: Spirit Identity Powder-Generated Far Infrared Radiation Inhibits the Proliferation of Human Male Liver Cancer Cells by Activating the Transmembrane Attack Complex. Applied Sciences. 2022;12(19):9416. doi:10.3390/app12199416. DOI: https://doi.org/10.3390/app12199416
NASA Science. Infrared Waves. https://science.nasa.gov/ems/07_infraredwaves/. Ac-cessed February 23, 2024.
Wikipedia. Emissivity. https://en.wikipedia.org/wiki/Emissivity. Accessed February 26, 2024.
Owen T. ASTER Global Emissivity Database: 100 Times More Detailed than its Predecessors. https://terra.nasa.gov/news/aster-global-emissivity-database-100-times-more-detailed-than-its-predecessors. Accessed February 21, 2024.
Charlton M, Stanley SA, Whitman Z, et al. The effect of constitutive pigmentation on the measured emissivity of human skin. PLoS One. 2020;15(11):e0241843. doi:10.1371/journal.pone.0241843. DOI: https://doi.org/10.1371/journal.pone.0241843
Kimeswenger S, Schwarz A, Födinger D, et al. Infrared A radiation promotes survival of human melanocytes carrying ultraviolet radiation-induced DNA damage. Exp Dermatol. 2016;25(6):447-452. doi:10.1111/exd.12968. DOI: https://doi.org/10.1111/exd.12968
Jantschitsch C, Weichenthal M, Maeda A, Proksch E, Schwarz T, Schwarz A. Infrared radiation does not enhance the frequency of ultraviolet radiation-induced skin tumors, but their growth behaviour in mice. Exp Dermatol. 2011;20(4):346-350. doi:10.1111/j.1600-0625.2011.01257.x. DOI: https://doi.org/10.1111/j.1600-0625.2011.01257.x
Laukkanen JA, Mäkikallio TH, Khan H, Laukkanen T, Kauhanen J, Kunutsor SK. Finnish sauna bathing does not increase or decrease the risk of cancer in men: A prospective cohort study. Eur J Cancer. 2019;121:184-191. doi:10.1016/j.ejca.2019.08.031. DOI: https://doi.org/10.1016/j.ejca.2019.08.031

Downloads
Published
Issue
Section
License
Copyright (c) 2024 Yury Rusinovich, Volha Rusinovich, Markus Doss (Author)

This work is licensed under a Creative Commons Attribution-ShareAlike 4.0 International License.


Add a Comment:
Comments:
Article views: 0