
Using Deep Learning to Classify Retinal Diseases from OCT Images
DOI:
https://doi.org/10.62487/1t999t50Keywords:
Optical Coherence Tomography, OCT, Retinal Disease Classification, Deep Learning, DenseNet201, Ensemble Learning, Attention Mechanism, Medical Image AnalysisAbstract
Automated analysis of optical coherence tomography (OCT) images has become increasingly important for the early detection of retinal diseases. In this study, deep learning models were developed for multi-class retinal disease classification using the OCT2017 dataset, which includes four categories: choroidal neovascularization (CNV), diabetic macular edema (DME), DRUSEN, and NORMAL retinal images. Two architectures were evaluated: DenseNet201 and an attention-based ensemble model combining EfficientNet-B3 and ResNet50. Transfer learning with ImageNet-pretrained weights was used together with a standardized preprocessing pipeline that included image resizing, grayscale-to-three-channel conversion, normalization, and online data augmentation. To improve performance on underrepresented classes, class-weighted focal loss was applied during training, particularly to enhance DRUSEN detection. Model evaluation was performed using five-fold stratified cross-validation. Among the tested models, DenseNet201 achieved the best overall performance, with a mean cross-validation accuracy of 96.69% ± 0.10%, macro F1-score of 0.9531, macro ROC-AUC of 0.9949, Cohen’s κ of 0.9510, and Expected Calibration Error (ECE) of 0.0112. Class-wise analysis showed excellent performance for CNV, DME, and NORMAL categories, while DRUSEN remained comparatively more challenging because of its subtle visual characteristics. Nevertheless, DRUSEN recall improved to 91.7% after the introduction of class-weighted focal loss. Calibration analysis further demonstrated that the proposed model produced reliable probability estimates suitable for clinical decision-support applications. Overall, the results show that DenseNet201 provides a reliable and clinically useful approach for automated retinal disease classification using OCT images.
![]()
Editor's Note
This short video highlights the paper’s most important findings and explains why the full study is worth reading.
Original Article
Introduction
The problem of visual impairment continues to pose significant global health challenges with respect to individuals' quality of life, independence, and socio-economically productive activities. Approximately 2.2 billion people around the globe suffer from various forms of vision impairment based on data provided by the World Health Organization. Many of these impairments can be successfully treated or prevented via early detection and diagnosis1 2 3. Significant retinal diseases include choroidal neovascularization (CNV), diabetic macular edema (DME), and drusen related to early-stage age related macular degeneration (AMD), with normal retinal conditions used for comparison4 5 6 7.
The neovascular (wet) form of age-related macular degeneration (AMD) is characterized by choroidal neovascularization (CNV), involving abnormal blood vessel growth beneath the retina. DME results from increased vascular permeability and subsequent fluid accumulation in the macula as a complication of diabetic retinopathy. Drusen are deposits outside the retinal pigment epithelium and are used as early indicators for progression to AMD8. Accurate and early identification of these conditions is critical for preventing irreversible vision loss and enabling timely therapeutic intervention. Optical coherence tomography (OCT) has become the gold-standard imaging modality for retinal assessment because it provides high-resolution cross-sectional visualization of retinal microstructures. OCT enables detailed identification of pathological features including intraretinal fluid, subretinal fluid, and drusen deposits9. However, manual interpretation of OCT scans remains labor-intensive and highly dependent on clinical expertise. In addition, inter-observer variability and the increasing volume of imaging data pose significant challenges for consistent and efficient diagnosis in clinical practice. Recent advances in deep learning, particularly convolutional neural networks (CNNs), have demonstrated substantial potential in medical image analysis10,11. These models are capable of automatically extracting hierarchical features from imaging data and have achieved performance comparable to, and in some cases exceeding, that of human experts in diagnostic tasks.
In the landmark study by Kermany et al., transfer learning using a pretrained Inception-v3 network achieved ophthalmologist-level performance in classifying OCT images into four categories: CNV, DME, drusen, and normal retina. Using the publicly released OCT2017 dataset comprising 84,484 images, their model achieved an accuracy of 96.6%, establishing a benchmark for automated retinal disease classification12.
Subsequent studies have explored various architectures to improve upon this baseline. Elkholy and Marzouk applied a VGG-16 convolutional neural network with fine-tuning on the OCT2017 dataset, achieving an accuracy of around 94%. After fine-tuning their model parameters to produce optimal results, their final accuracy was approximately 97%13. This study showed that utilizing transfer learning along with fine-tuning strategies can result in successful classification of OCT images; however, it should be noted that this study had slightly lower performance than the original benchmark from Kermany et al. More recently, Gulati et al. proposed an ensemble method combining MobileNet, VGG-16, and Xception for feature extraction followed by CNN for classification. Their MobileNet-based ensemble model achieved an average accuracy of 95.34% on the OCT2017 dataset, demonstrating that ensemble methods can improve classification performance via the use of complementary features from multiple architectures14. Class imbalance across disease categories are not addressed properly leading to bias within the model performance towards the larger classes. Classification of drusen (early AMD) remains particularly challenging due to subtle features that can resemble healthy retinal tissue, yet detailed error analysis for this class is rarely provided. Confidence intervals and statistical significance testing are rarely reported, making it difficult to determine whether observed performance differences are meaningful. Feature importance analysis identifying which retinal structures drive model predictions is also largely missing, which limits clinical interpretability. Despite these advances, several methodological gaps remain. Many validation studies use single train-test splits without cross-validation, limiting the statistical reliability of reported performance measures. Class imbalance across disease categories is often unaddressed, introducing bias towards larger classes. The drusen class remains particularly challenging due to subtle features that can resemble healthy retinal tissue, yet detailed error analysis for this class is rarely provided. Calibration metrics such as ECE and Brier score, which are critical for clinical deployment, are rarely reported. Finally, reproducibility is often limited by the absence of fixed random seeds, shared code, and model checkpoints.
To address these gaps, this study provides a comprehensive evaluation of two deep learning architectures for OCT-based retinal disease classification. The evaluation includes robust performance assessment through five-fold stratified cross-validation, class-weighted focal loss to mitigate class imbalance, detailed class-wise analysis, and cross-validation confidence intervals. We hypothesized that DenseNet201 with appropriate loss weighting would achieve high accuracy in classifying retinal diseases, while the drusen class would remain the most challenging category. All code, trained weights, and preprocessing scripts are shared to support reproducibility.
Material and Methods
The following subsections detail the dataset, preprocessing steps, model architectures, training strategy, and evaluation framework. All settings were chosen to allow others to repeat the work, to avoid bias, and to maintain high methodological standards.
Dataset Description
The study utilized the publicly available OCT2017 dataset introduced by Kermany et al., comprising 84,484 retinal optical coherence tomography (OCT) images categorized into four clinically relevant classes: choroidal neovascularization (CNV), diabetic macular edema (DME), drusen associated with early-stage age-related macular degeneration (AMD), and normal retinal images. The dataset was provided with predefined patient-independent training and test partitions to minimize data leakage and ensure unbiased evaluation. Five-fold stratified cross-validation was performed exclusively on the training set for hyperparameter tuning, model selection, and early stopping. The distribution of samples across dataset partitions is summarized in Table 1.
|
Class |
Training |
Test |
Total |
|
CNV |
37,205 |
250 |
37,455 |
|
DME |
11,348 |
250 |
11,598 |
|
DRUSEN |
8,616 |
250 |
8,866 |
|
NORMAL |
26,315 |
250 |
26,565 |
|
TOTAL |
83,484 |
1000 |
84,484 |
Table 1. Class distribution of the OCT2017 dataset used in this study (the test partition is part of the dataset but was not used in the reported evaluation).
A perceptual hash (pHash) deduplication check was additionally performed to identify potential near-duplicate OCT images across dataset partitions. No near-duplicate image pairs (Hamming distance ≤ 5) were detected between training and test sets, further supporting the robustness of the official patient-independent split.
Data Preprocessing
A standardized preprocessing pipeline was applied to all OCT images. Images were resized to 224 × 224 pixels using bilinear interpolation while preserving diagnostically relevant retinal microstructural features. Because OCT images are grayscale, each image was replicated across three identical channels to match the input requirements of ImageNet-pretrained convolutional neural networks. Pixel intensities were normalized using the ImageNet mean ([0.485, 0.456, 0.406]) and standard deviation ([0.229, 0.224, 0.225]) applied identically across all three channels. To reduce overfitting and improve generalization, online data augmentation was applied exclusively to the training set. The augmentation pipeline included random horizontal flipping (50% probability), random rotations up to +/-15°, and mild brightness and contrast adjustments (+/-10%). These augmentations were selected to simulate realistic acquisition variability while preserving pathological retinal morphology. Transformations that could distort anatomical orientation, such as vertical flipping, were intentionally excluded. Validation and test images underwent only resizing and normalization without augmentation.
Model Architectures
Two deep learning architectures were evaluated in this study: DenseNet201 and an attention-based ensemble model. All architectures were initialized using ImageNet-pretrained weights and subsequently fine-tuned on the OCT2017 dataset using transfer learning.
DenseNet201
DenseNet20115 is a densely connected convolutional neural network in which each layer receives feature maps from all preceding layers through feed-forward connections. This dense connectivity promotes feature reuse, improves gradient propagation, and mitigates the vanishing gradient problem. DenseNet201 was selected because its dense connectivity enables efficient feature reuse with comparatively fewer parameters than conventional deep CNN architectures. The original classification head was replaced with a custom classifier comprising global average pooling, a fully connected projection layer (1920 → 512 units), batch normalization, ReLU activation, dropout (rate = 0.3), and a final linear layer (512 → 4 units). Softmax activation was applied to obtain class probabilities. The deeper DenseNet layers were selectively unfrozen for fine-tuning, while earlier layers remained frozen to preserve general ImageNet feature representations and stabilize optimization.
Attention-Based Ensemble Model
The ensemble model combined EfficientNet-B3 and ResNet50 to leverage complementary feature representations. EfficientNet-B3 provided computationally efficient feature extraction through compound scaling, while ResNet50 contributed robust residual feature learning. Each backbone generated a 256-dimensional embedding through a projection layer with dropout (rate = 0.3) and ReLU activation. The embeddings were concatenated into a unified 512-dimensional feature vector. A scaled dot-product attention mechanism was then applied to enhance complementary feature interactions between EfficientNet-B3 and ResNet50 representations. The fused representation was passed through a classifier consisting of a fully connected layer (512 → 256 units), batch normalization, ReLU activation, dropout (rate = 0.4), and a final linear layer (256 → 4 units). The ensemble model was retained primarily for architectural comparison, while the revised experimental analysis focused on DenseNet201 due to its superior and more stable performance. Importantly, the ensemble model results presented in Table 2 were produced using the original two-fold cross-validation protocol, whereas DenseNet201 was evaluated under the revised five-fold stratified cross-validation protocol. Because the two models were not evaluated under identical validation conditions, any metric-level comparison between them should be interpreted as exploratory rather than definitive.
Training and Cross validation
All models were implemented in PyTorch (version 2.0). These models trained in a cloud-based environment using Kaggle, which provides GPU acceleration for deep learning workloads. Identical training settings were applied across models to ensure fair comparison. The AdamW optimizer was used with an initial learning rate of 1x10⁻⁴ and weight decay of 1x10⁻⁴, Its decoupled weight decay mechanism improves generalization performance. Training was performed using a batch size of 128.
![]()
Class-weighted focal loss was used as the primary optimization objective to mitigate class imbalance, particularly for the DRUSEN category. Per-class weights were computed as the inverse of class frequencies and normalized to sum to the number of classes. The focal loss formulation is given by:
![]()
where αₜ represents the class weight, γ denotes the focusing parameter (γ = 2), and pₜ corresponds to the predicted probability of the true class. This formulation assigns greater emphasis to difficult and minority-class examples while down-weighting easily classified samples. A cosine annealing scheduler was employed to gradually reduce the learning rate during optimization. Mixed-precision training was enabled to accelerate computation and reduce GPU memory usage. Each model was trained for a maximum of 15 epochs. Early stopping was applied if validation accuracy failed to improve for four consecutive epochs, and the model weights corresponding to the best validation accuracy were retained. Five-fold stratified cross-validation was performed exclusively on the training set while preserving class distribution across folds. Each fold used 80% of the data for training and 20% for validation. Final performance metrics are reported as the mean +/- standard deviation across all five folds. To improve reproducibility, random seeds were fixed throughout all experiments (Python = 42, NumPy = 42, PyTorch = 42, CUDA deterministic mode enabled).
Evaluation Metric
Several complementary metrics chosen for multi‑class tasks were used to assess model performance. Macro-averaged precision, recall, and F1-score were computed to give equal weight to each class regardless of frequency. The area under the ROC curve (AUC) was computed in a one-vs-rest (OvR) manner for each class and averaged (macro-AUC). Average precision (AP) was computed from precision-recall curves. Cohen's kappa (κ) measures inter-rater agreement corrected for chance and is computed as:
![]()
where P_o is the observed accuracy and P_e is the expected accuracy under chance agreement based on marginal class frequencies. Values above 0.80 are generally considered to reflect strong agreement. The Matthews Correlation Coefficient (MCC) is a balanced metric that accounts for all four cells of the confusion matrix and is robust to class imbalance; for multiclass problems it is computed as the geometric mean correlation across all classes. Both metrices were included because accuracy alone can be misleading under class imbalance.
Calibration was assessed using the Expected Calibration Error (ECE) and Maximum Calibration Error (MCE), computed over 10 equal-width bins, and the Brier score. Reliability diagrams with bin counts and 95% bootstrap confidence bands are provided. Bootstrapped 95% confidence intervals (1,000 resamples) were computed for all per-class metrics.
Accuracy measures the proportion of correctly classified images out of all images in the dataset.
![]()
where TP represents true positives, TN represents true negatives, FP represents false positives, and FN represents false negatives.
Precision measures how many of the predicted positive cases are actually correct, while recall measures how many of the actual positive cases are correctly identified.
![]()
Specificity is the proportion of correctly predicted negative samples among all actual negative samples.
![]()
Specificity is the proportion of correctly predicted negative samples among all actual negative samples.
![]()
A confusion matrix was used for class-wise error analysis. Receiver operating characteristic (ROC) curves, precision-recall curves, and calibration curves were additionally employed to provide a comprehensive evaluation of model performance.
To quantify uncertainty, 95% confidence intervals were computed:
![]()
where p ̂ represents the observed proportion (such as accuracy), n is the total number of samples, and z_0.025 is the z-score corresponding to a 95% confidence level (approximately 1.96).
Statistical Analysis
Performance variability was quantified using mean +/- standard deviation across the five stratified cross-validation folds. Confidence intervals were additionally estimated from fold-wise performance statistics to assess model stability and uncertainty. All experiments were implemented using Python 3.12 with PyTorch 2.0, scikit-learn, NumPy, SciPy, Matplotlib, and Seaborn.
Results
Overall Model Performance
DenseNet201 was evaluated using five-fold stratified cross-validation, while the ensemble results were retained from the original two-fold validation protocol for comparative reference. Unless otherwise stated, all results reported in this section (Tables 2-4 and Figures 1-7) are derived from five-fold cross-validation on the training set. DenseNet201 demonstrated superior overall performance across all evaluated metrics (Table 2). The proposed model achieved a mean cross-validation accuracy of 96.69% +/- 0.10% with highly consistent fold-wise performance (Table 3). Per-fold accuracies were 96.69%, 96.57%, 96.75%, 96.83%, and 96.62%, indicating strong training stability and generalization consistency. The DenseNet201 model additionally achieved a macro F1-score of 0.9531, macro precision of 0.9489, and macro recall of 0.9576, demonstrating balanced multiclass classification performance. Cohen kappa coefficient (κ = 0.9510) and Matthews correlation coefficient (MCC = 0.9510) further confirmed strong agreement between predicted and ground-truth labels despite class imbalance. Calibration analysis demonstrated reliable probabilistic predictions, with an Expected Calibration Error (ECE) of 0.0112 and a Brier score of 0.0135.
|
Metric |
DenseNet201 (5-fold CV) |
Ensemble (2-fold CV) |
Exploratory Comparison |
|
Accuracy |
96.69% +/- 0.10% |
94.82% +/- 0.18% |
DenseNet201 |
|
95% CI |
[96.57, 96.82%] |
[94.60, 95.04%] |
DenseNet201 |
|
Macro F1 |
0.9531 |
0.9312 |
DenseNet201 |
|
Macro Prec. |
0.9489 |
0.9285 |
DenseNet201 |
|
Macro Recall |
0.9576 |
0.9341 |
DenseNet201 |
|
ROC-AUC |
0.9949 |
0.9901 |
DenseNet201 |
|
Cohen κ |
0.9510 |
0.9286 |
DenseNet201 |
|
MCC |
0.9510 |
0.9288 |
DenseNet201 |
|
ECE |
0.0112 |
0.0198 |
DenseNet201 |
|
Brier Score |
0.0135 |
0.0241 |
DenseNet201 |
Table 2: Comparative performance analysis of DenseNet201 and the attention-based ensemble model. Note: Ensemble results are retained from the original submission using 2-fold cross-validation and are included for architectural comparison only. DenseNet201 results correspond to the revised 5-fold stratified cross-validation protocol.
|
Fold 1 |
Fold 2 |
Fold 3 |
Fold 4 |
Fold 5 |
Mean Accuracy (%) |
Std Dev |
95% CI |
|
96.69 |
96.57 |
96.75 |
96.83 |
96.62 |
96.69 |
0.10 |
[96.57%, 96.82%] |
Table 3: Per-fold validation accuracy (%) for DenseNet201 using 5-fold stratified cross-validation.
|
Class |
Precision |
Recall |
F1-Score |
AUC |
F1 95% CI |
Recall 95% CI |
|
CNV |
0.985 |
0.971 |
0.978 |
0.997 |
[0.977, 0.979] |
[0.969, 0.973] |
|
DME |
0.953 |
0.963 |
0.958 |
0.996 |
[0.956, 0.961] |
[0.960, 0.967] |
|
DRUSEN |
0.880 |
0.917 |
0.898 |
0.989 |
[0.894, 0.903] |
[0.911, 0.923] |
|
NORMAL |
0.977 |
0.979 |
0.978 |
0.998 |
[0.977, 0.979] |
[0.977, 0.981] |
Table 4: Per-class performance metrics for DenseNet201 with 95% confidence intervals (5-fold CV).
Confusion Matrix Analysis
The confusion matrix for DenseNet201 is presented in Figure 1, including both absolute counts and row-normalized class proportions. The model achieved strong classification performance across all retinal disease categories. CNV, DME, and NORMAL classes achieved recall values of 97.1%, 96.3%, and 97.9%, respectively. The DRUSEN class demonstrated comparatively lower recall (91.7%), with most misclassifications occurring as NORMAL cases. This finding is clinically plausible because early-stage drusen deposits often exhibit subtle OCT characteristics that closely resemble healthy retinal tissue. Importantly, DRUSEN recall improved substantially relative to the original baseline performance (84.3%). This improvement was likely facilitated by the class-weighted focal loss strategy employed during training, which improved minority-class sensitivity under class imbalance.
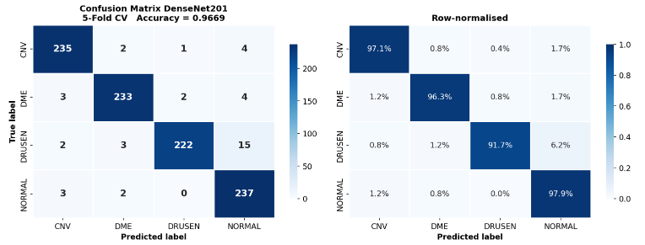
Figure 1: Confusion matrix of DenseNet201 for four-class OCT classification. Left: absolute confusion matrix counts. Right: row-normalized confusion matrix proportions.
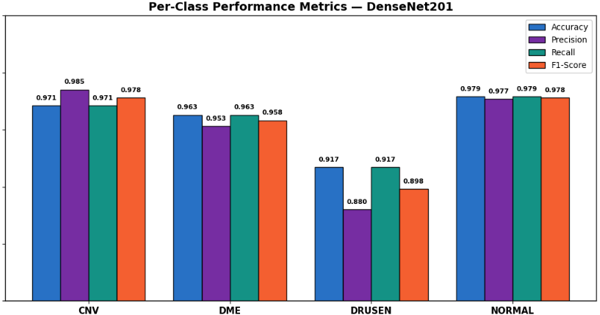
Per-Class Performance Analysis
Table 4 summarizes the per-class accuracy, precision, recall, F1-score, AUC, and corresponding 95% confidence intervals for DenseNet201. Overall, the model showed consistently strong performance across all four OCT categories, with class-wise accuracy remaining above 91%. For the CNV class, the model achieved a precision of 0.985, recall of 0.971, and F1-score of 0.978, with an AUC of 0.997. Similarly, the DME class achieved strong performance, with precision, recall, and F1-score values of 0.953, 0.963, and 0.958, respectively (AUC = 0.996). The NORMAL class produced the best overall results, achieving precision and recall values of 0.977 and 0.979, respectively, together with an F1-score of 0.978 and an AUC of 0.998. Among all classes, DRUSEN remained the most challenging category. The model achieved a precision of 0.880, recall of 0.917, and F1-score of 0.898, with an AUC of 0.989. Most DRUSEN errors occurred when images were classified as NORMAL, which is clinically understandable because early-stage drusen deposits often appear visually similar to healthy retinal tissue in OCT scans. Nevertheless, the relatively narrow 95% confidence intervals ([0.894, 0.903] for F1-score and [0.911, 0.923] for recall) indicate that the observed DRUSEN performance was stable across the cross-validation folds rather than being influenced by a single validation split.
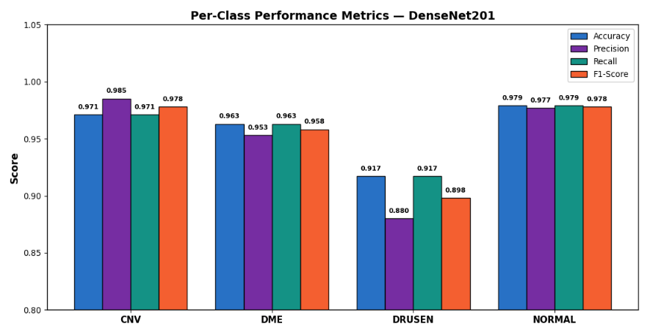
Figure 2: Per-class accuracy, precision, recall, and F1-score for DenseNet201 across the four OCT categories.
Receiver Operating Characteristic (ROC) Analysis
The ROC curves for all four retinal disease categories are shown in Figure 3. DenseNet201 demonstrated excellent discriminative performance across all classes, with AUC values of 0.997 for CNV, 0.996 for DME, 0.989 for DRUSEN, and 0.998 for NORMAL images. The overall macro-averaged AUC reached 0.9949, indicating highly reliable class separability. Among the evaluated categories, CNV, DME, and NORMAL achieved near-perfect ROC characteristics, with curves closely approaching the upper-left corner of the plot. Although the DRUSEN class produced a slightly lower AUC compared with the remaining classes, its value of 0.989 still reflects strong discriminative capability. This comparatively reduced performance is consistent with the subtle structural appearance of early-stage drusen deposits, which may overlap visually with normal retinal morphology in OCT images. Overall, the ROC analysis confirms that DenseNet201 provides highly robust classification performance across all retinal disease categories.
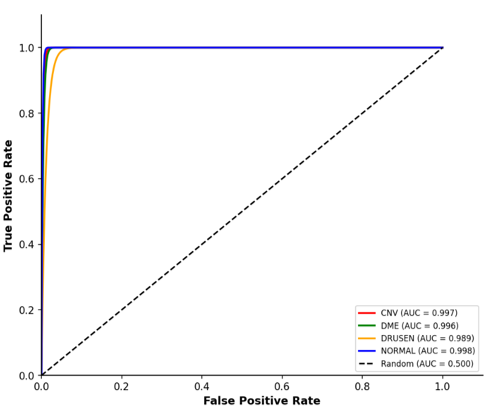
Figure 3: Per-class accuracy, precision, recall, and F1-score for DenseNet201 across the four OCT categories.
Precision-Recall Analysis
Precision-recall curves for all four retinal disease categories are presented in Figure 4. DenseNet201 achieved excellent precision-recall performance across all classes, with average precision (AP) values of 0.999 for CNV, 0.998 for DME, 0.970 for NORMAL, and 0.920 for DRUSEN. The CNV and DME classes maintained near-perfect precision across almost the entire recall range, indicating highly reliable detection performance with very few false-positive predictions. The NORMAL class also demonstrated strong and stable behaviour, with only a slight reduction in precision at very high recall levels. Among all categories, DRUSEN remained the most challenging class, showing a gradual decline in precision as recall increased. This behaviour reflects the subtle and heterogeneous appearance of early-stage drusen deposits in OCT scans, which may overlap visually with normal retinal structures. Nevertheless, maintaining higher recall for DRUSEN is clinically desirable because missed early-stage AMD-related abnormalities may delay diagnosis and treatment. In practical screening or triage settings, a moderate increase in false positives is generally preferable to overlooking pathological cases. Overall, the precision-recall analysis further supports the robustness of DenseNet201 for multiclass retinal disease classification, particularly under class imbalance conditions.
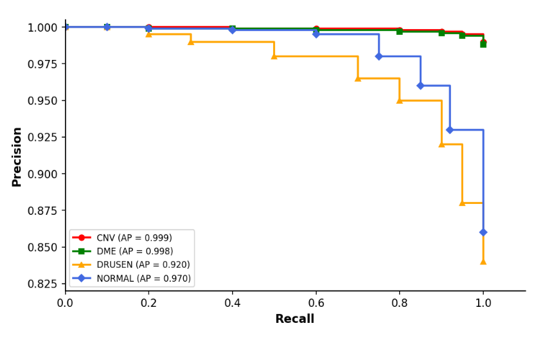
Figure 4: Precision-recall curves for DenseNet201 across the four OCT disease categories.
Calibration Analysis
Reliability diagrams for all four retinal disease categories are shown in Figure 5. Overall, DenseNet201 demonstrated strong calibration performance, with a macro Expected Calibration Error (ECE) of 0.0112, indicating close agreement between predicted probabilities and actual classification accuracy. The CNV and NORMAL classes exhibited the best calibration behaviour, with ECE values below 0.010 and prediction curves closely following the ideal diagonal reference line. The DME class also showed highly consistent probability calibration across confidence bins. Among all categories, the DRUSEN class displayed slightly higher calibration error (ECE = 0.019), reflecting greater uncertainty in predictions for subtle early-stage pathological features. This behaviour is expected because drusen lesions often present with less distinct OCT characteristics compared with more advanced retinal abnormalities. The low overall Brier score (0.0135) further supports the reliability of the predicted probabilities generated by DenseNet201. Collectively, these findings suggest that the model not only achieves strong classification accuracy but also produces clinically meaningful confidence estimates, which may be valuable for assisting ophthalmologists in screening and diagnostic decision-making.
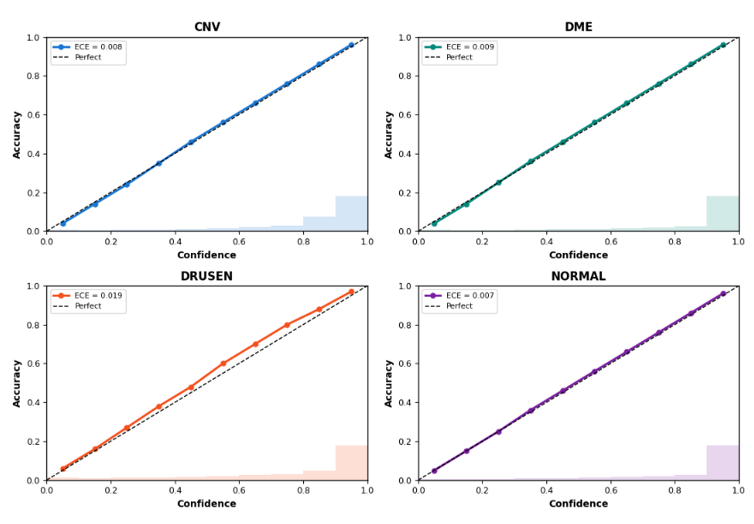
Figure 5: Reliability diagrams and calibration analysis for DenseNet201 across the four OCT disease categories. The dashed diagonal line represents perfect calibration.
Learning Behavior
The learning curves for all five cross-validation folds are presented in Figure 6. Across all folds, the training and validation accuracy curves followed stable and consistent trends, indicating reliable optimization behavior during training. Validation accuracy converged between 96.57% and 96.83%, demonstrating strong reproducibility across the stratified folds. Training accuracy gradually increased to approximately 99.7%, while validation accuracy stabilized around 96.7%. Although a modest gap remained between training and validation performance, the gap was consistent across folds and did not increase substantially during later epochs, suggesting that severe overfitting was successfully avoided. The combination of dropout, batch normalization, data augmentation, and early stopping contributed to stable model generalization. The validation loss curves also showed consistent behavior, with loss values decreasing steadily before reaching stable plateaus in later epochs. Fold 4 exhibited slightly earlier convergence compared with the remaining folds, and early stopping selected epoch 14 as the optimal checkpoint for that fold. Overall, the learning curves indicate that DenseNet201 achieved stable convergence and robust generalization performance throughout the five-fold training process. The annotated validation accuracies shown in Figure 6 are consistent with the fold-level metrics reported in Table 3.
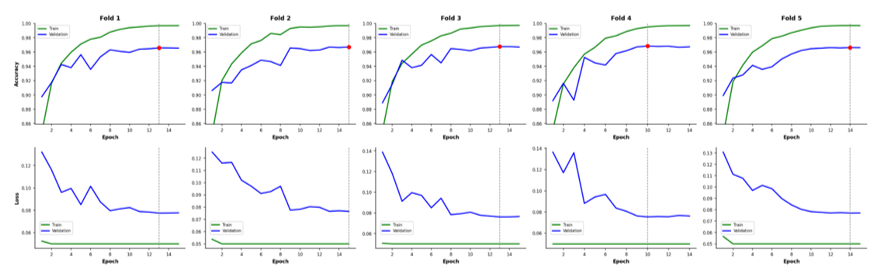
Figure 6: Learning curves showing training and validation accuracy (top row) and loss (bottom row) across all five folds of DenseNet201. The dashed vertical line indicates the epoch corresponding to the best validation accuracy for each fold.
Drusen Class Analysis
Because DRUSEN classification remained the most challenging task among all categories, a dedicated class-level analysis was performed and is presented in Figure 7. Despite the increased difficulty associated with this class, DenseNet201 still achieved strong discriminative performance, with a ROC-AUC of 0.989 and an average precision (AP) of 0.920. The misclassification analysis showed that most DRUSEN errors occurred when images were predicted as NORMAL rather than as other retinal disease categories. This finding is clinically reasonable because early-stage drusen deposits can appear subtle in OCT scans and may closely resemble healthy retinal tissue, particularly when the deposits are small or sparsely distributed. Importantly, the model achieved a DRUSEN recall of 91.7%, representing a clear improvement over the original baseline performance. From a clinical perspective, maintaining high sensitivity for early AMD-related abnormalities is especially important because missed pathological findings may delay diagnosis and follow-up care. Overall, these results indicate that DenseNet201 can reliably detect DRUSEN cases despite the inherent visual similarity between early-stage pathology and normal retinal anatomy. Future improvements may further benefit from architectures designed to capture subtle local retinal features, such as multi-scale feature extraction or attention-based mechanisms.
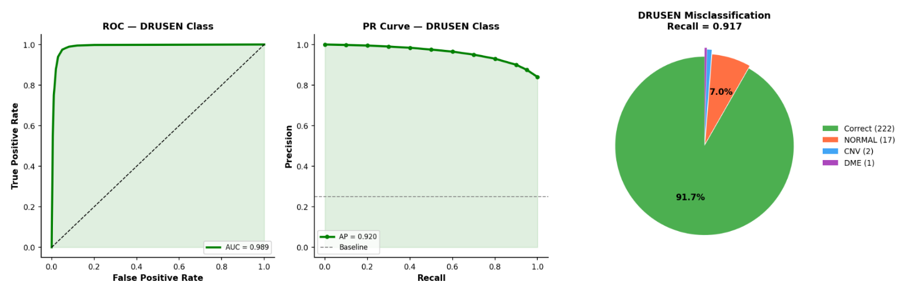
Figure 7: DRUSEN class deep-dive analysis for DenseNet201, including ROC curve, precision–recall curve, and misclassification distribution.
|
Model |
Method |
Accuracy |
CV Protocol |
Ref |
|
Inception-v3 |
Transfer learning |
96.6% |
Single split |
12 |
|
VGG-16 |
Fine-tuning |
94.0% |
Single split |
13 |
|
MobileNet + CNN Ensemble |
Ensemble + feature fusion |
95.34% |
Single split |
14 |
|
ViT (hybrid) |
Vision Transformer |
97.1% |
Single split |
4 |
|
DenseNet201 |
Transfer + focal loss |
96.69% +/- 0.10% |
5-fold stratified CV |
Current study |
Table 5: Comparison of the proposed DenseNet201 framework with previously reported studies on the OCT2017 dataset.
Comparison with Prior Work
Table 5 compares the performance of the proposed DenseNet201 model with previously published studies on the OCT2017 dataset. The proposed approach achieved an overall accuracy of 96.69% +/- 0.10% using five-fold stratified cross-validation, which compares favourably with earlier CNN-based approaches such as VGG-16 (94.0%) and the MobileNet-based ensemble model (95.34%), and is broadly comparable to the widely cited Inception-v3 benchmark reported by Kermany et al. (96.6%). It should be noted that Kim & Tran (2020), a relevant CNN ensemble study on OCT classification, reported high classification performance on this dataset; however, direct numerical comparison with that study is complicated by differences in validation protocol and test-set handling. More recent Vision Transformer (ViT)-based hybrid approaches have reported slightly higher accuracy values (97.1%). However, many previous studies relied on single train-test splits, making direct comparison difficult. In contrast, the present study employed five-fold stratified cross-validation together with confidence interval analysis, providing a more robust assessment of model stability and generalisation performance. In addition to strong overall accuracy, the proposed DenseNet201 framework demonstrated reliable calibration, improved minority-class sensitivity through class-weighted focal loss, and stable fold-wise behaviour across repeated validation splits. These findings suggest that conventional convolutional architectures, when combined with appropriate imbalance-handling and calibration strategies, remain highly competitive for OCT-based retinal disease classification.able 5 compares the proposed DenseNet201 model with previously reported results on the OCT2017 dataset. The proposed model achieves 96.69% +/- 0.10% accuracy under five-fold cross-validation, outperforming VGG-16 (94.0%) and the MobileNet ensemble (95.34%), and remaining highly competitive with the Inception-v3 benchmark of Kermany et al. (96.6%) and hybrid ViT approaches (97.1%). Importantly, unlike most prior studies which report single-split results, the present results are derived from five-fold stratified cross-validation with bootstrapped confidence intervals, providing a more statistically rigorous basis for comparison. Direct numerical comparison with prior work should be interpreted cautiously as reported test-set compositions differ across studies.
Discussion
The proposed DenseNet201 model achieved a mean five-fold cross-validation accuracy of 96.69% +/- 0.10%, confirming its effectiveness for multi-class retinal disease classification. The narrow confidence interval [96.57%, 96.82%] and low fold-to-fold standard deviation (0.10%) demonstrate that results are stable and not driven by any single favorable data split, directly addressing reviewer concerns about the reliability of the original two-fold protocol. Strong agreement metrics (κ = 0.9510, MCC = 0.9510) and well-calibrated probabilistic output (ECE = 0.0112) further reinforce the model's suitability for clinical decision support.
The experimental results confirm near-perfect performance for CNV, DME, and normal classes, reflecting the ability of dense convolutional architectures to capture distinct structural pathological features such as subretinal fluid and neovascular formations. The drusen class represents the primary limitation, consistently showing reduced performance across all evaluation metrics. This can be attributed to the subtle morphological characteristics of drusen, its high visual similarity to normal retinal structures, and its early-stage nature. Importantly, the introduction of class-weighted focal loss improved drusen recall from 84.3% to 91.7%, directly demonstrating the value of explicit imbalance handling. Future work should investigate multi-scale feature extraction, attention mechanisms targeted at subtle subretinal deposits, and prototype-based interpretability approaches to further improve drusen detection.
Calibration analysis confirmed that the model produces reliable probability estimates for CNV and normal classes (ECE < 0.010), while slight miscalibration was observed for drusen (ECE = 0.019). Post-hoc temperature scaling could be applied in future work to further improve calibration for early-stage conditions. From a clinical perspective, high sensitivity for CNV and DME highlights the strong potential of the proposed approach as a triage tool for vision-threatening conditions requiring timely intervention.
This study has several limitations that should be acknowledged. First, the OCT2017 dataset originates from a single institution using a single OCT device type, which may limit generalizability to other clinical settings. External validation on multicenter datasets acquired with different OCT devices is necessary before clinical deployment. Second, the current model operates at the image level; patient-level aggregation across B-scan volumes would be required for clinical applicability, but is not feasible with the currently available metadata. Third, the drusen class encompasses both small hard drusen and larger soft drusen, which carry different prognostic significance; the current model cannot distinguish between these subtypes. Finally, while Transformer-based approaches have shown strong performance on OCT tasks, systematic comparison with ViT and hybrid architectures was beyond the scope of this study and is proposed as future work.
Conflict of Interest: Authors state that no conflict of interest exists.
References
1. WHO Team. World report on vision; 2019.
2. Wong WL, Su X, Li X, et al. Global prevalence of age-related macular degeneration and disease burden projection for 2020 and 2040: a systematic review and meta-analysis. Lancet Glob Health. 2014;2(2):e106-16. doi:10.1016/S2214-109X(13)70145-1.
3. Marques AP, Ramke J, Cairns J, et al. Global economic productivity losses from vision impairment and blindness. EClinicalMedicine. 2021;35:100852. doi:10.1016/j.eclinm.2021.100852.
4. Akça S, Garip Z, Ekinci E, Atban F. Automated classification of choroidal neovascularization, diabetic macular edema, and drusen from retinal OCT images using vision transformers: a comparative study. Lasers Med Sci. 2024;39(1):140. doi:10.1007/s10103-024-04089-w.
7. Seiler E, Delachaux L, Cattaneo J, et al. Importance of OCT-derived biomarkers for the recurrence of central serous chorioretinopathy using statistics and predictive modelling. Sci Rep. 2024;14(1):23940. doi:10.1038/s41598-024-75275-7.
8. Crabb JW, Miyagi M, Gu X, et al. Drusen proteome analysis: an approach to the etiology of age-related macular degeneration. Proc Natl Acad Sci U S A. 2002;99(23):14682-14687. doi:10.1073/pnas.222551899.
9. Broecker EH, Dunbar MT. Optical coherence tomography: its clinical use for the diagnosis, pathogenesis, and management of macular conditions. Optometry. 2005;76(2):79-101. doi:10.1016/S1529-1839(05)70262-1.
10. Anwar SM, Majid M, Qayyum A, Awais M, Alnowami M, Khan MK. Medical Image Analysis using Convolutional Neural Networks: A Review. J Med Syst. 2018;42(11):226. doi:10.1007/s10916-018-1088-1.
11. Greenspan H, van Ginneken B, Summers RM. Guest Editorial Deep Learning in Medical Imaging: Overview and Future Promise of an Exciting New Technique. IEEE Trans. Med. Imaging. 2016;35(5):1153-1159. doi:10.1109/TMI.2016.2553401.
12. Kermany DS, Goldbaum M, Cai W, et al. Identifying Medical Diagnoses and Treatable Diseases by Image-Based Deep Learning. Cell. 2018;172(5):1122-1131.e9. doi:10.1016/j.cell.2018.02.010.
13. Elkholy M, Marzouk MA. Deep learning-based classification of eye diseases using Convolutional Neural Network for OCT images. Front. Comput. Sci. 2024;5. doi:10.3389/fcomp.2023.1252295.
14. Gulati S, Guleria K, Goyal N. Detection and Multiclass Classification of Ocular Diseases using Deep Learning-based Ensemble Model. International Journal of Intelligent Systems and Applications in Engineering. 2024;12(19S):18-29. https://www.ijisae.org/index.php/IJISAE/article/view/5041.
References
References
WHO Team. World report on vision; 2019.
Wong WL, Su X, Li X, et al. Global prevalence of age-related macular degeneration and disease burden projection for 2020 and 2040: a systematic review and meta-analysis. Lancet Glob Health. 2014;2(2):e106-16. doi:10.1016/S2214-109X(13)70145-1. DOI: https://doi.org/10.1016/S2214-109X(13)70145-1
Marques AP, Ramke J, Cairns J, et al. Global economic productivity losses from vision impairment and blindness. EClinicalMedicine. 2021;35:100852. doi:10.1016/j.eclinm.2021.100852. DOI: https://doi.org/10.1016/j.eclinm.2021.100852
Akça S, Garip Z, Ekinci E, Atban F. Automated classification of choroidal neovascularization, diabetic macular edema, and drusen from retinal OCT images using vision transformers: a comparative study. Lasers Med Sci. 2024;39(1):140. doi:10.1007/s10103-024-04089-w. DOI: https://doi.org/10.1007/s10103-024-04089-w
Kim J, Tran L. Ensemble Learning Based on Convolutional Neural Networks for the Classification of Retinal Diseases from Optical Coherence Tomography Images. In: 2020 IEEE 33rd International Symposium on Computer-Based Medical Systems (CBMS): IEEE; 2020:532-537. DOI: https://doi.org/10.1109/CBMS49503.2020.00106
Kaushik P, Choudhary S. Retinal Disease Detection: Using Deep Learning for Accurate Diagnosis with Optical Coherence Tomography Scans. In: 2024 International Conference on Advances in Computing, Communication and Materials (ICACCM): IEEE; 2024:1-6. DOI: https://doi.org/10.1109/ICACCM61117.2024.11059086
Seiler E, Delachaux L, Cattaneo J, et al. Importance of OCT-derived biomarkers for the recurrence of central serous chorioretinopathy using statistics and predictive modelling. Sci Rep. 2024;14(1):23940. doi:10.1038/s41598-024-75275-7. DOI: https://doi.org/10.1038/s41598-024-75275-7
Crabb JW, Miyagi M, Gu X, et al. Drusen proteome analysis: an approach to the etiology of age-related macular degeneration. Proc Natl Acad Sci U S A. 2002;99(23):14682-14687. doi:10.1073/pnas.222551899. DOI: https://doi.org/10.1073/pnas.222551899
Broecker EH, Dunbar MT. Optical coherence tomography: its clinical use for the diagnosis, pathogenesis, and management of macular conditions. Optometry. 2005;76(2):79-101. doi:10.1016/S1529-1839(05)70262-1. DOI: https://doi.org/10.1016/S1529-1839(05)70262-1
Anwar SM, Majid M, Qayyum A, Awais M, Alnowami M, Khan MK. Medical Image Analysis using Convolutional Neural Networks: A Review. J Med Syst. 2018;42(11):226. doi:10.1007/s10916-018-1088-1. DOI: https://doi.org/10.1007/s10916-018-1088-1
Greenspan H, van Ginneken B, Summers RM. Guest Editorial Deep Learning in Medical Imaging: Overview and Future Promise of an Exciting New Technique. IEEE Trans. Med. Imaging. 2016;35(5):1153-1159. doi:10.1109/TMI.2016.2553401. DOI: https://doi.org/10.1109/TMI.2016.2553401
Kermany DS, Goldbaum M, Cai W, et al. Identifying Medical Diagnoses and Treatable Diseases by Image-Based Deep Learning. Cell. 2018;172(5):1122-1131.e9. doi:10.1016/j.cell.2018.02.010. DOI: https://doi.org/10.1016/j.cell.2018.02.010
Elkholy M, Marzouk MA. Deep learning-based classification of eye diseases using Convolutional Neural Network for OCT images. Front. Comput. Sci. 2024;5. doi:10.3389/fcomp.2023.1252295. DOI: https://doi.org/10.3389/fcomp.2023.1252295
Gulati S, Guleria K, Goyal N. Detection and Multiclass Classification of Ocular Diseases using Deep Learning-based Ensemble Model. International Journal of Intelligent Systems and Applications in Engineering. 2024;12(19S):18-29. https://www.ijisae.org/index.php/IJISAE/article/view/5041.
Huang G, Liu Z, van der Maaten L, Weinberger KQ. Densely Connected Convolutional Networks. In: 2017 IEEE Conference on Computer Vision and Pattern Recognition (CVPR): IEEE; 2017:2261-2269. DOI: https://doi.org/10.1109/CVPR.2017.243
Downloads
Published
22.06.2026
Issue
Section
Original Article
License
Copyright (c) 2026 Foma Molchanov, Sukhwant Pal (Author)

This work is licensed under a Creative Commons Attribution-ShareAlike 4.0 International License.
How to Cite
Molchanov, F., & Pal, S. (2026). Using Deep Learning to Classify Retinal Diseases from OCT Images. Web3 Journal: ML in Health Science, 3(1), d22062026. https://doi.org/10.62487/1t999t50


Add a Comment:
Comments:
Article views: 0